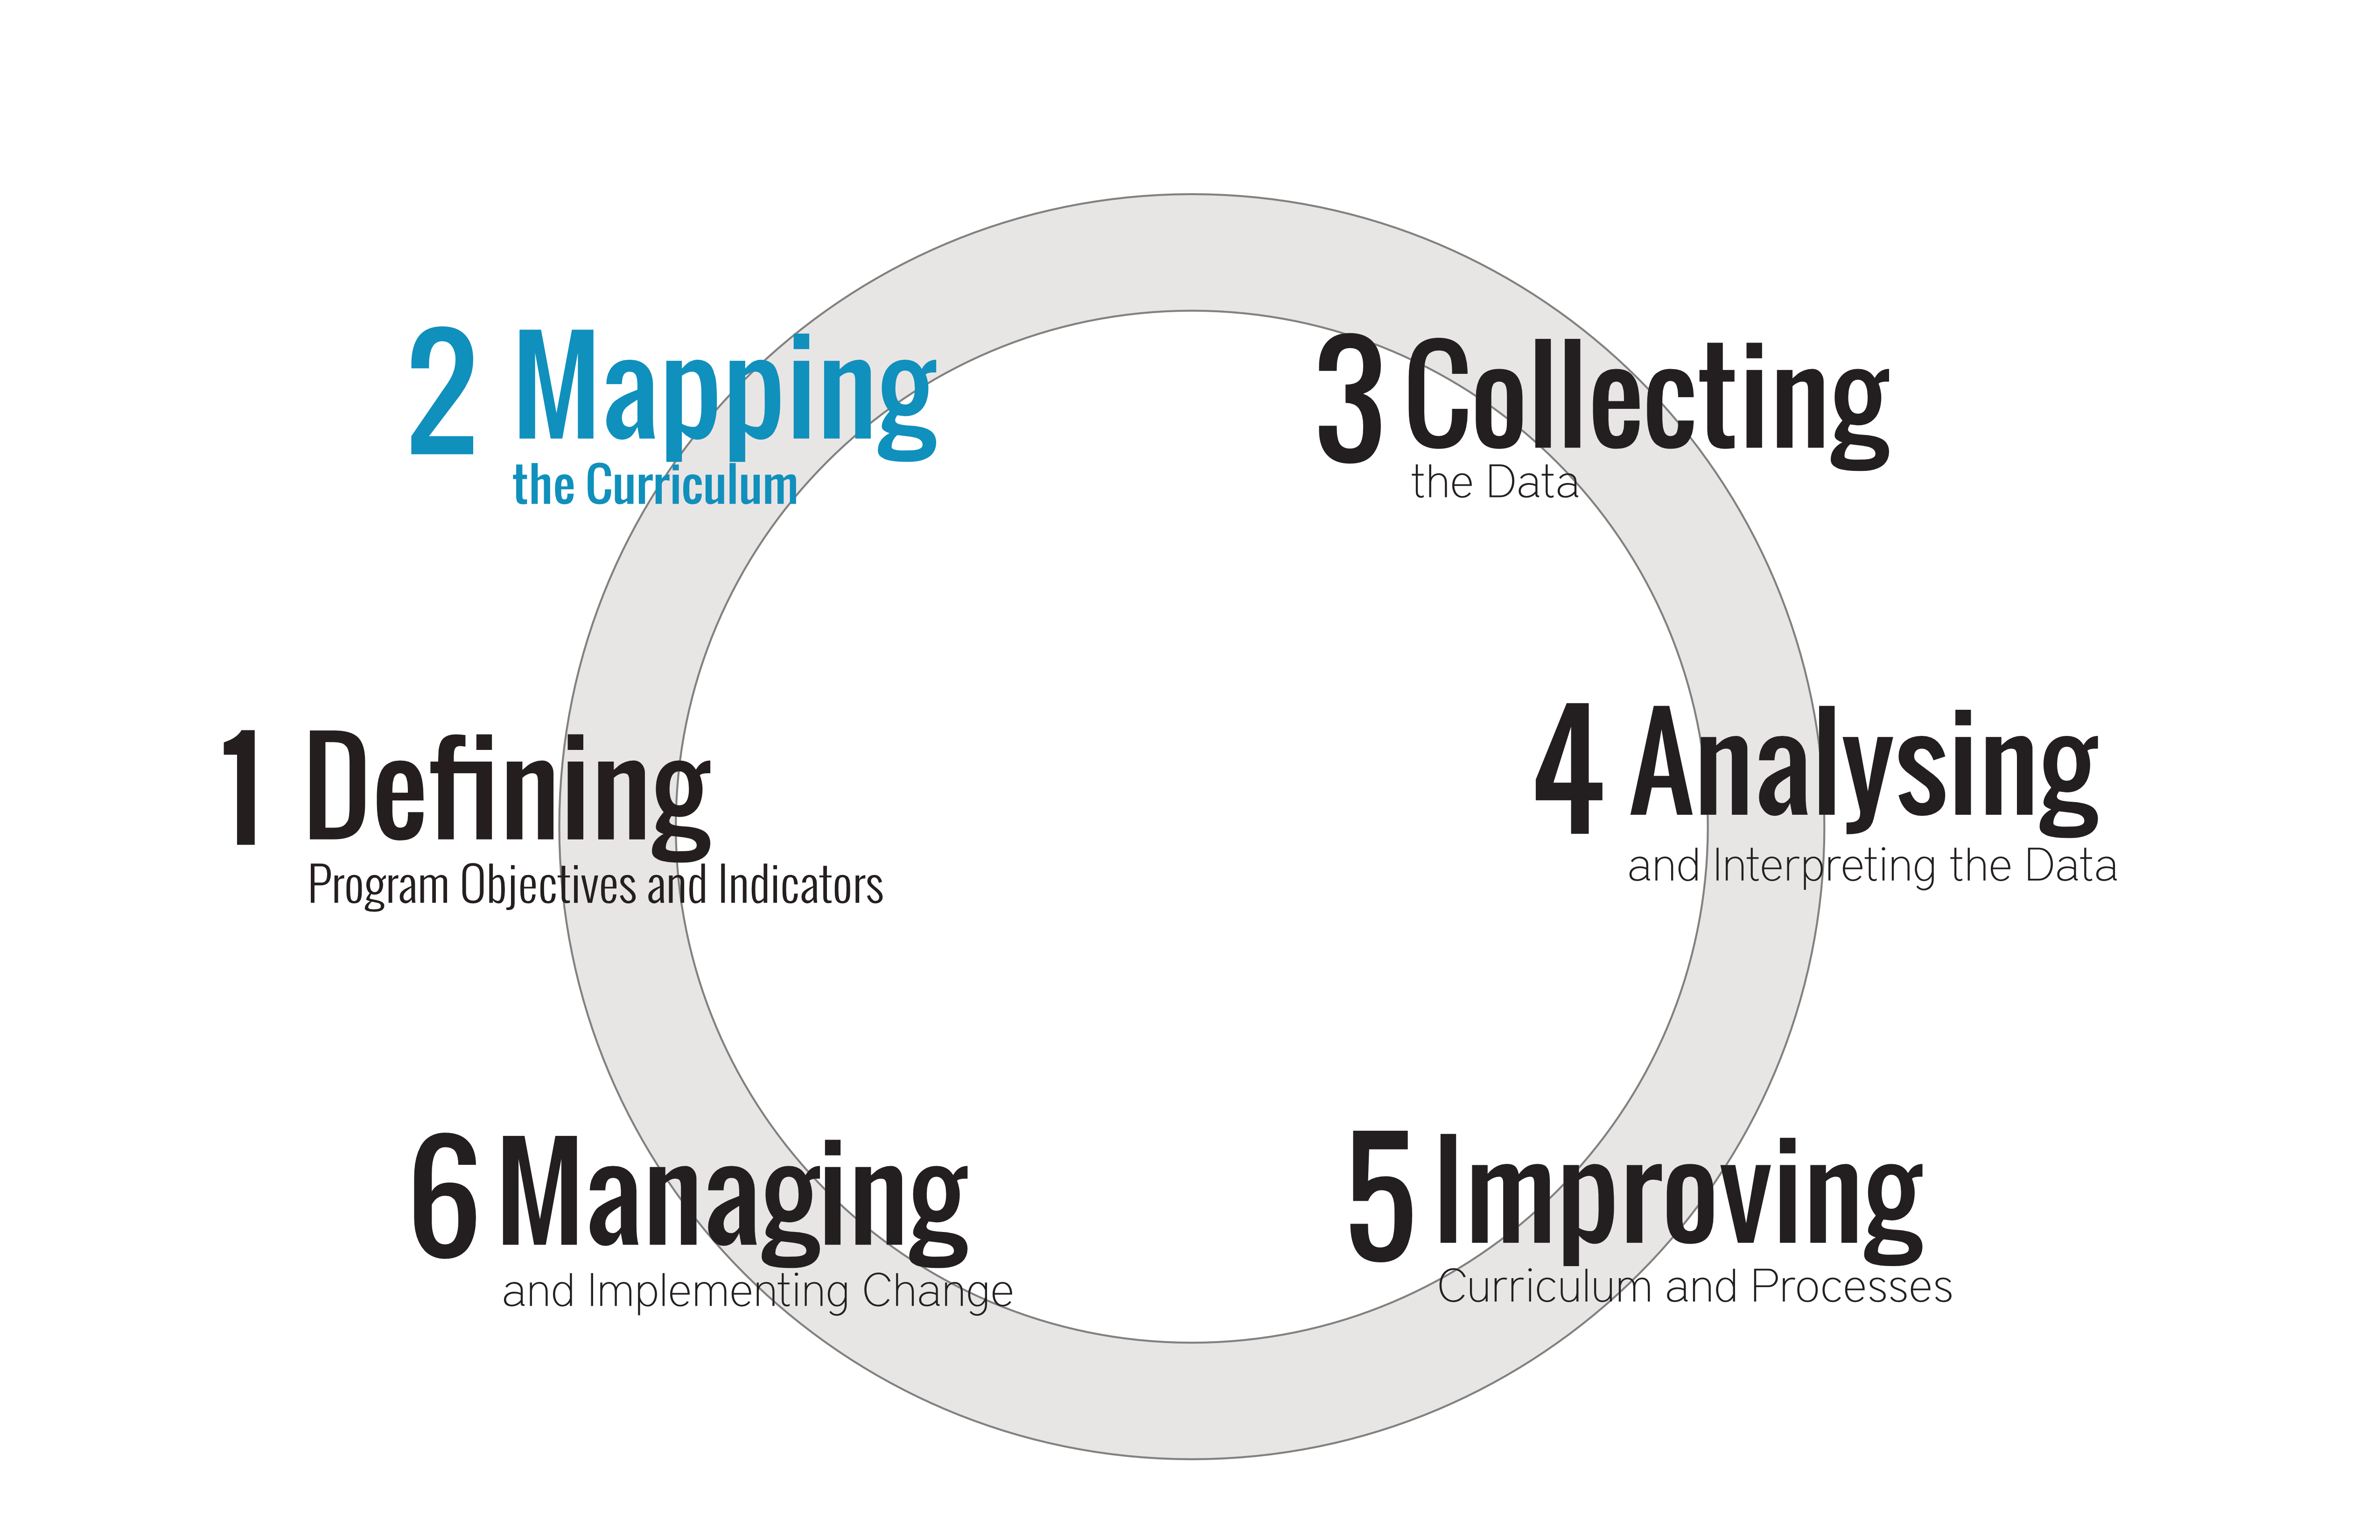
What Is Mapping?
Curriculum mapping is a way to document and share curricula across programs and examine the whole for gaps, overlaps and redundancies. It’s a way of finding out where and how knowledge and skills are developed and enables programs to assess how well programming and processes are aligned to intended outcomes.
Mapping is a process that enables each faculty member to record the content and skills taught and how those skills and knowledge are assessed and aligned to the achievement of identified graduate attributes. The data generated through mapping enables informed program improvement.
Curriculum mapping can create an atmosphere of joint responsibility for student success. The process provides a forum for discussion and planning for improvement of the ways content, skills and standards are supported within a larger system.
The process invites a shift in thinking about curriculum as static to one that recognizes curriculum as dynamic, adaptive and evolving.
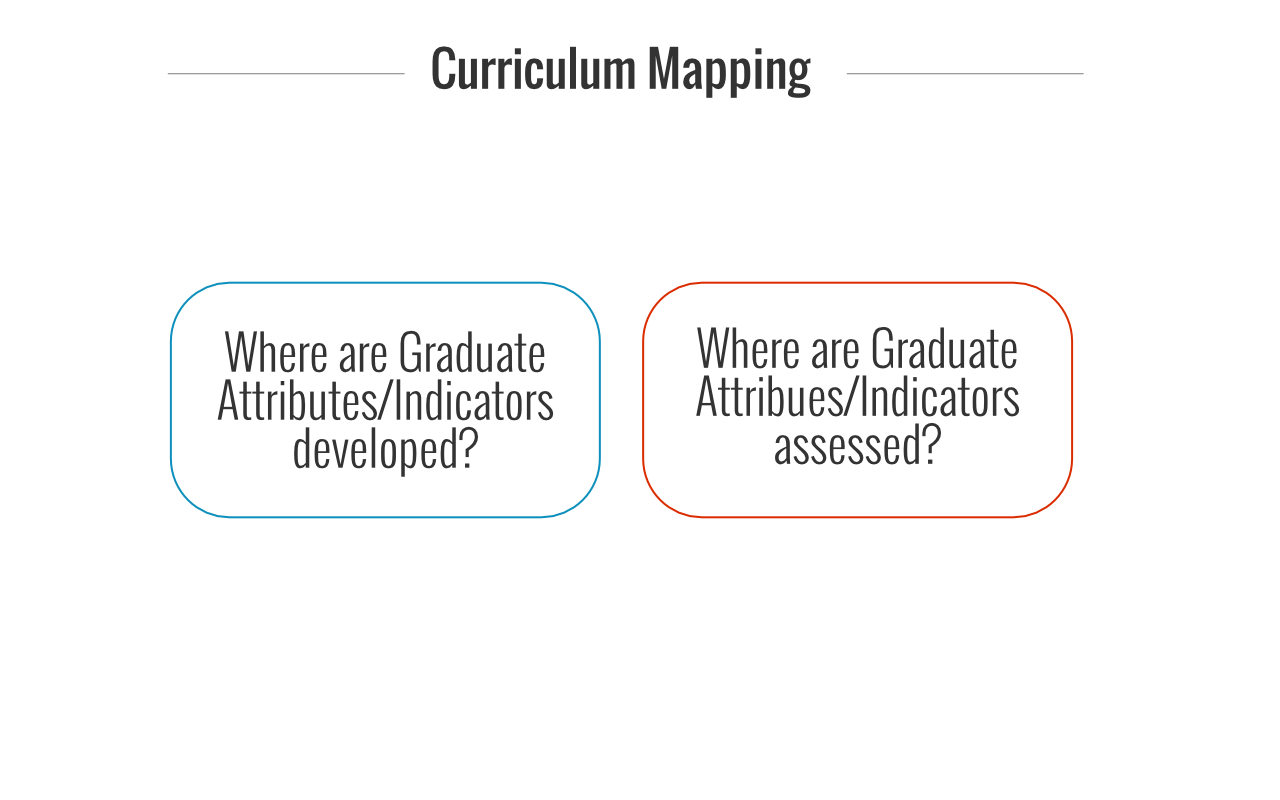
The first step in mapping Course Learning Outcomes to Indicators is to determine:
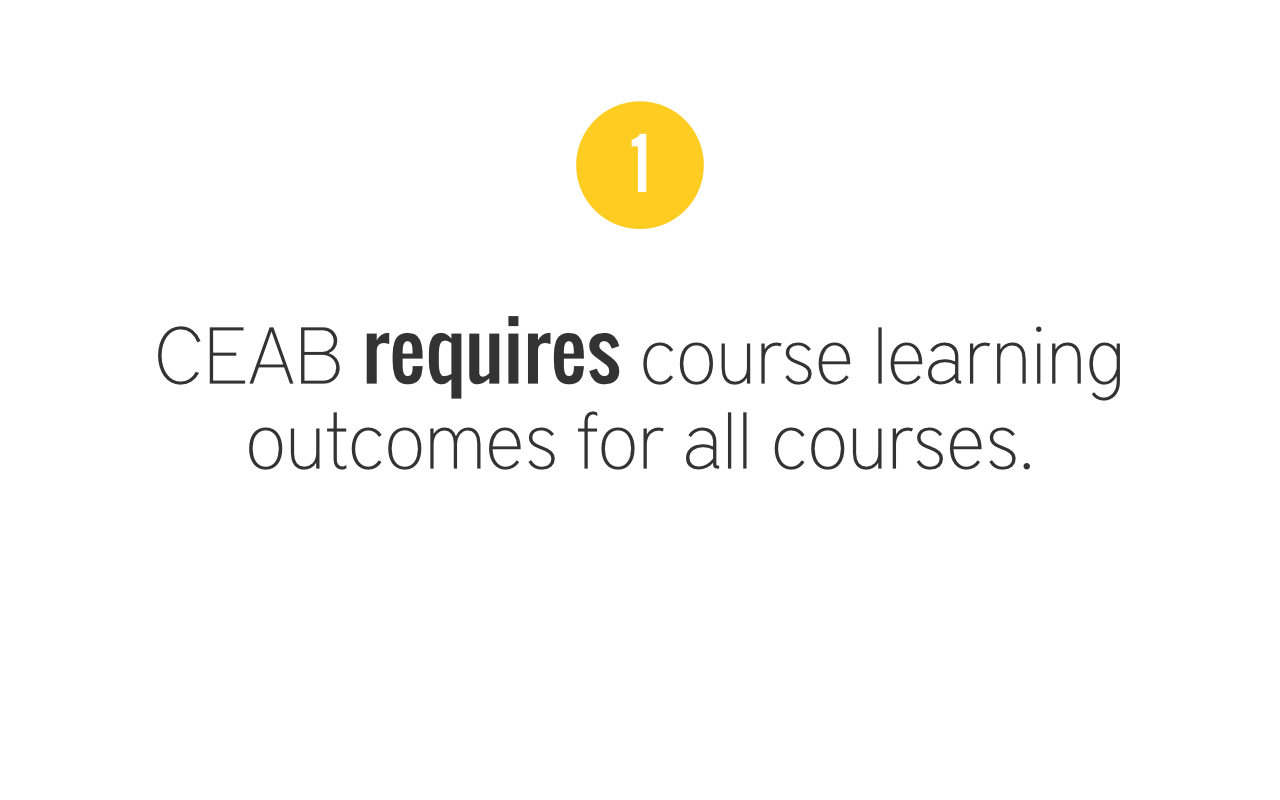
It is also important that all course instructors be made aware that:
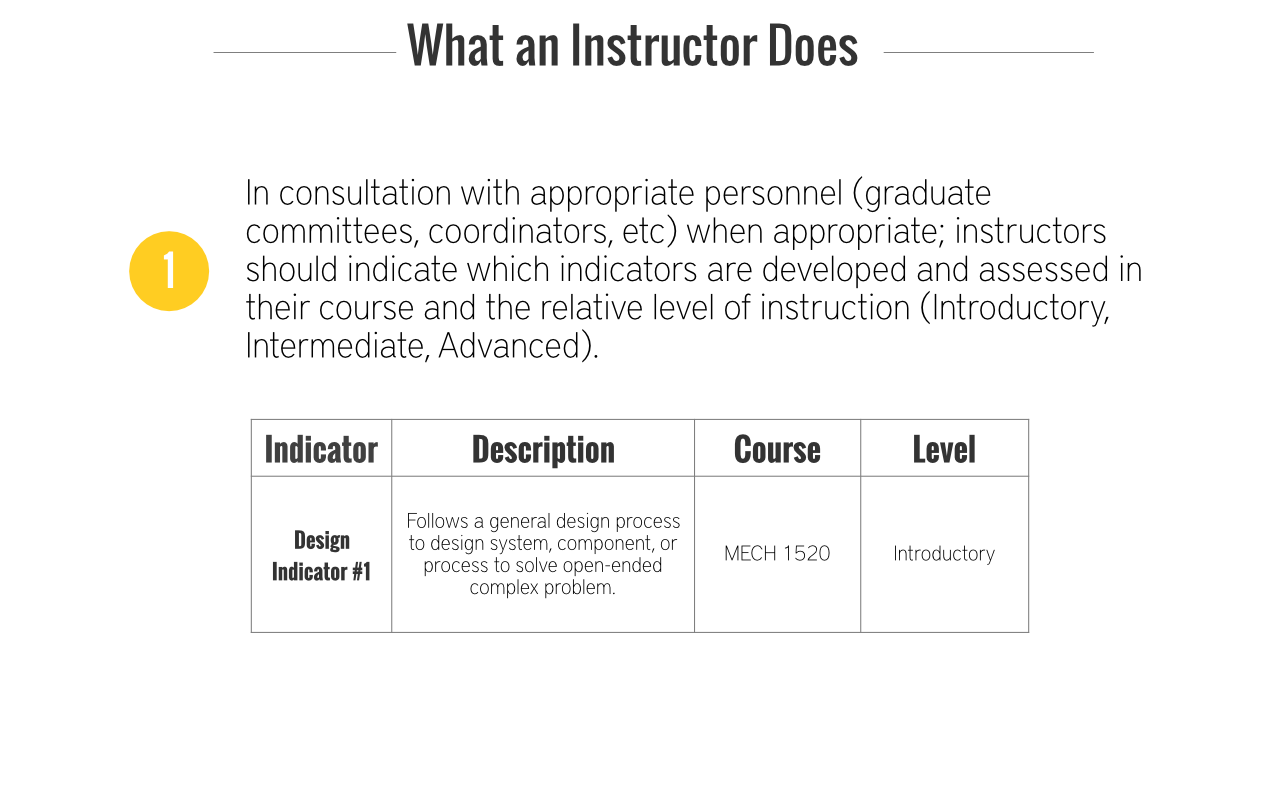
In developing Course Learning Outcomes instructors should:
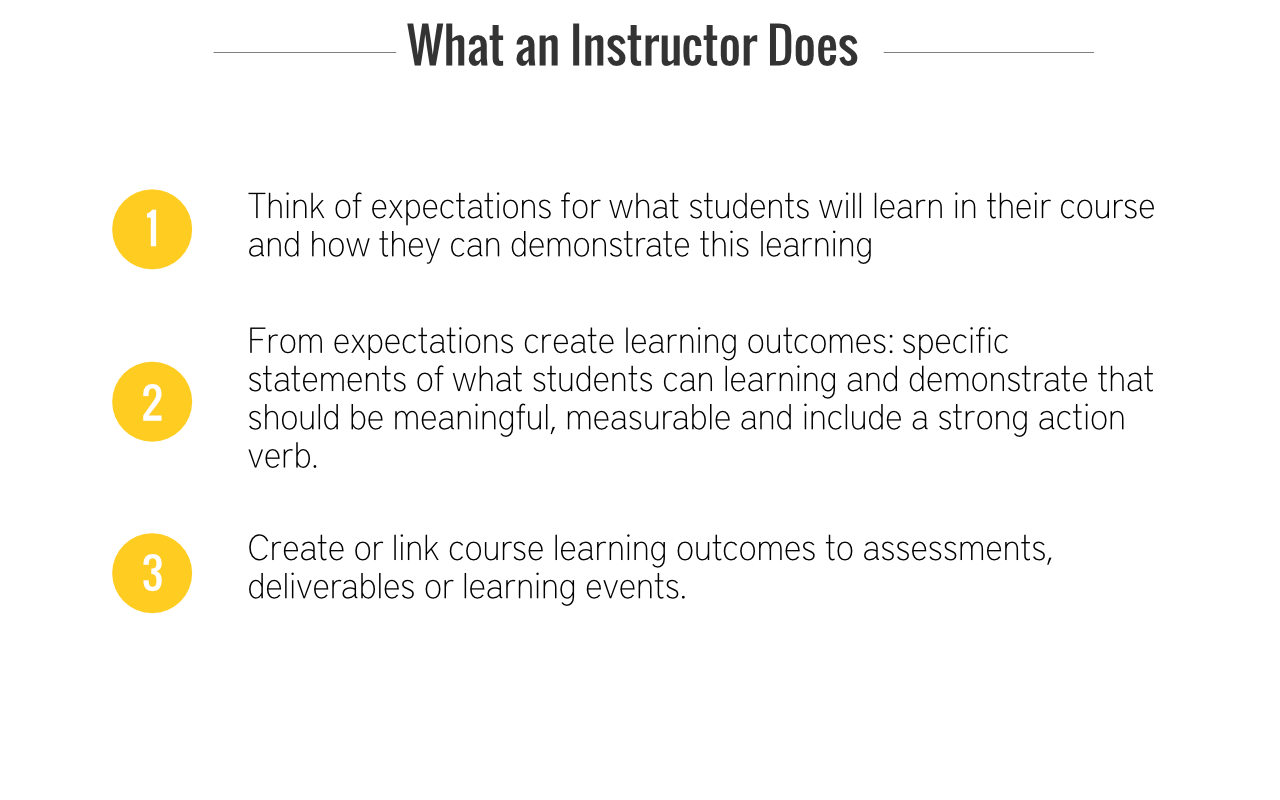
In mapping Course Learning Outcomes to Indicators, instructors should:
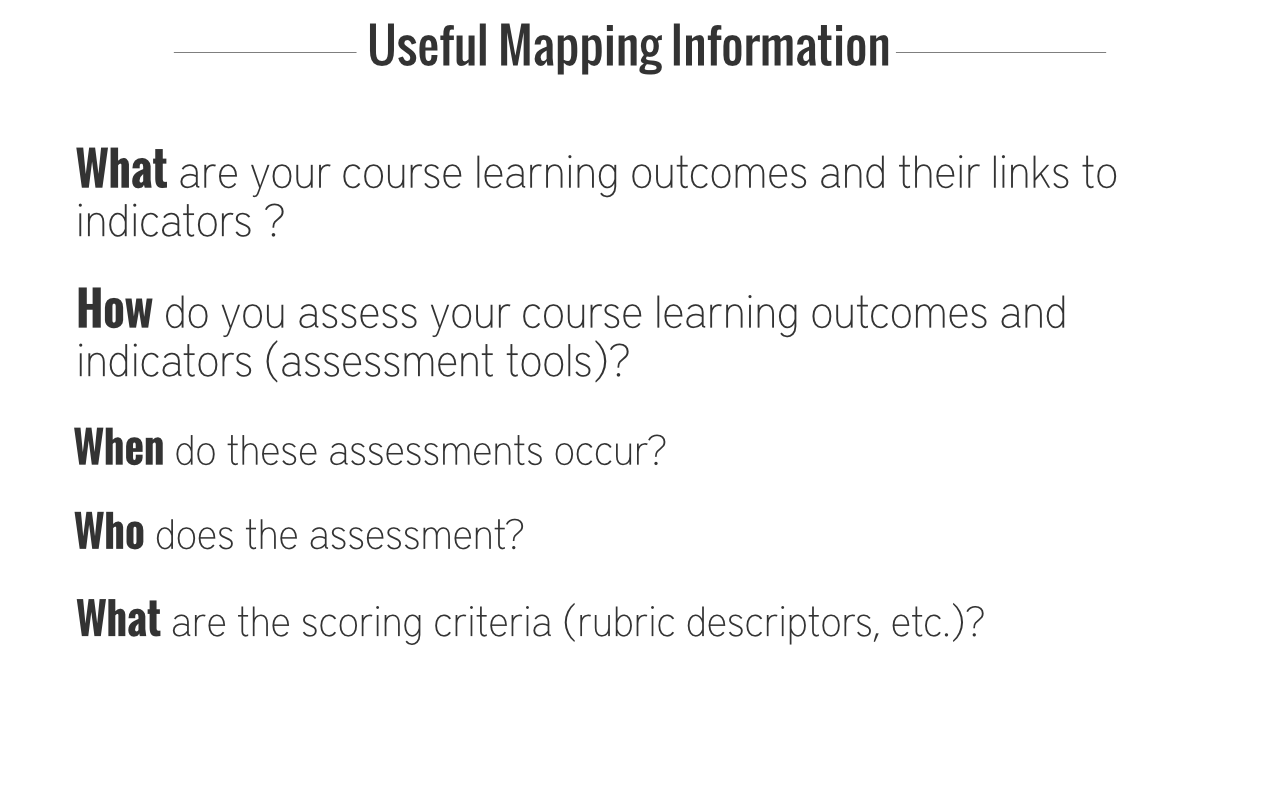
When considering how to map your learning outcomes it is worth considering:
There are several approaches to curriculum mapping, each providing a different way to implement mapping or providing a unique perspective on arrangement of and progression through the curriculum.
- Attributes and Indicators to Courses
- Courses to Attributes and Indicators
- Assessment Mapping
- Alignment Mapping
- Progression Mapping
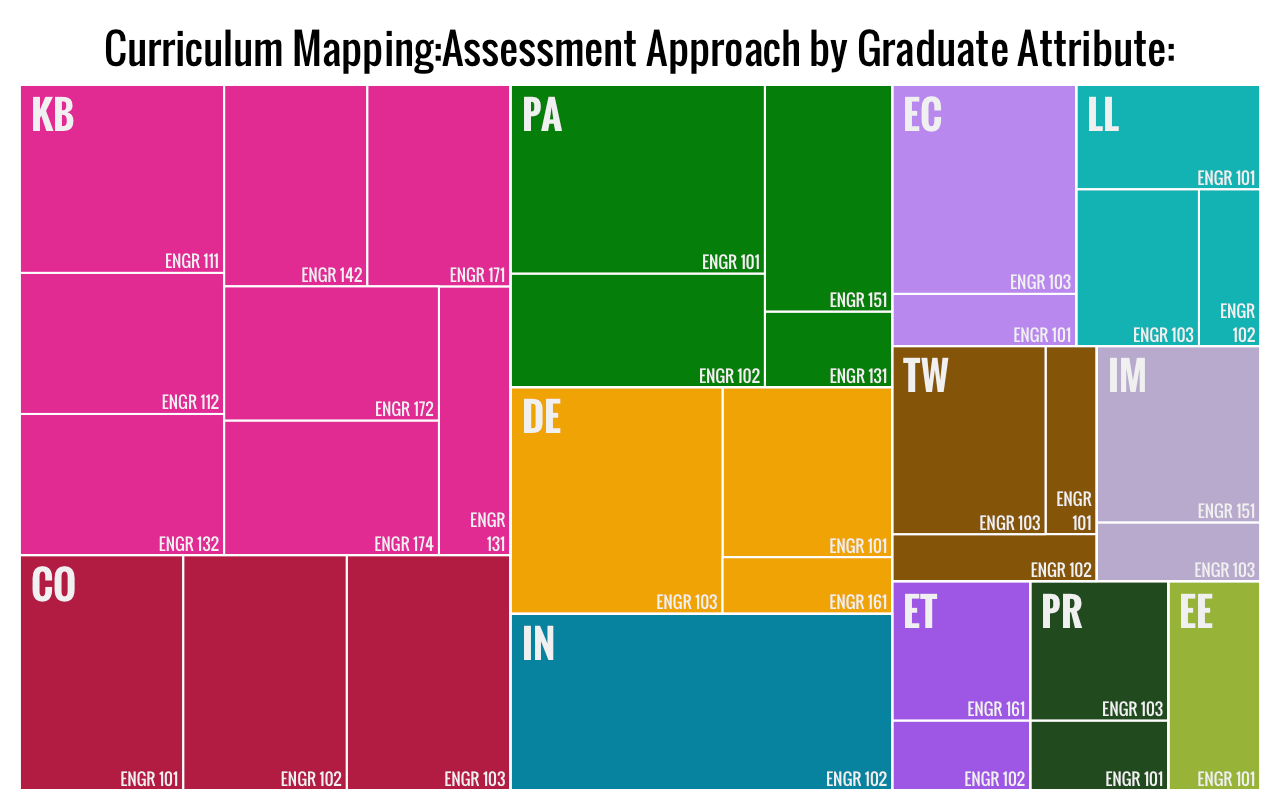
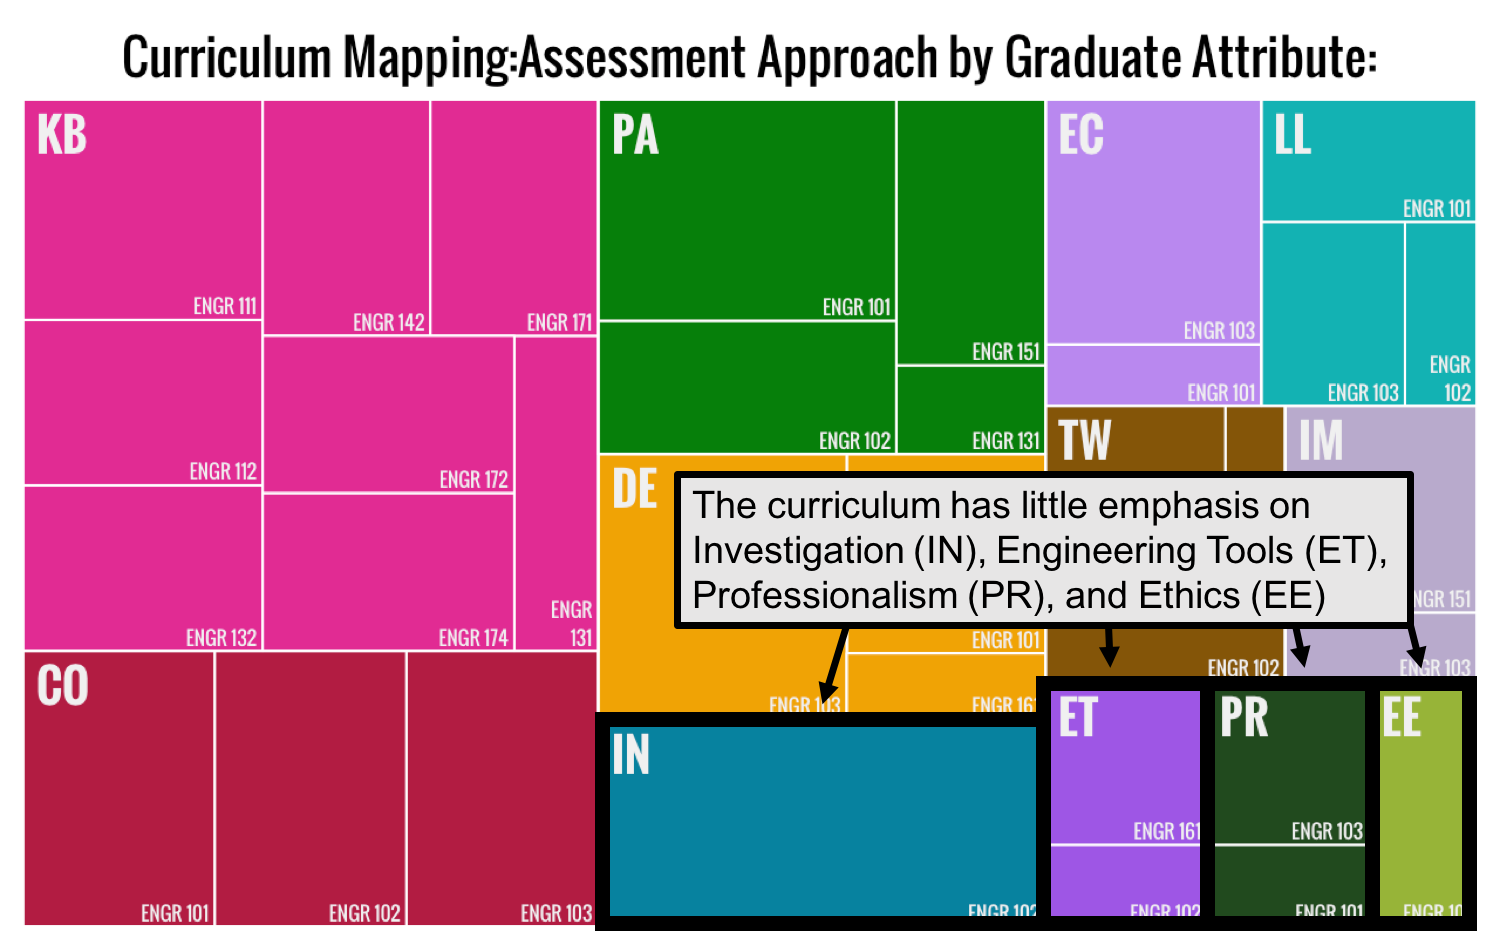
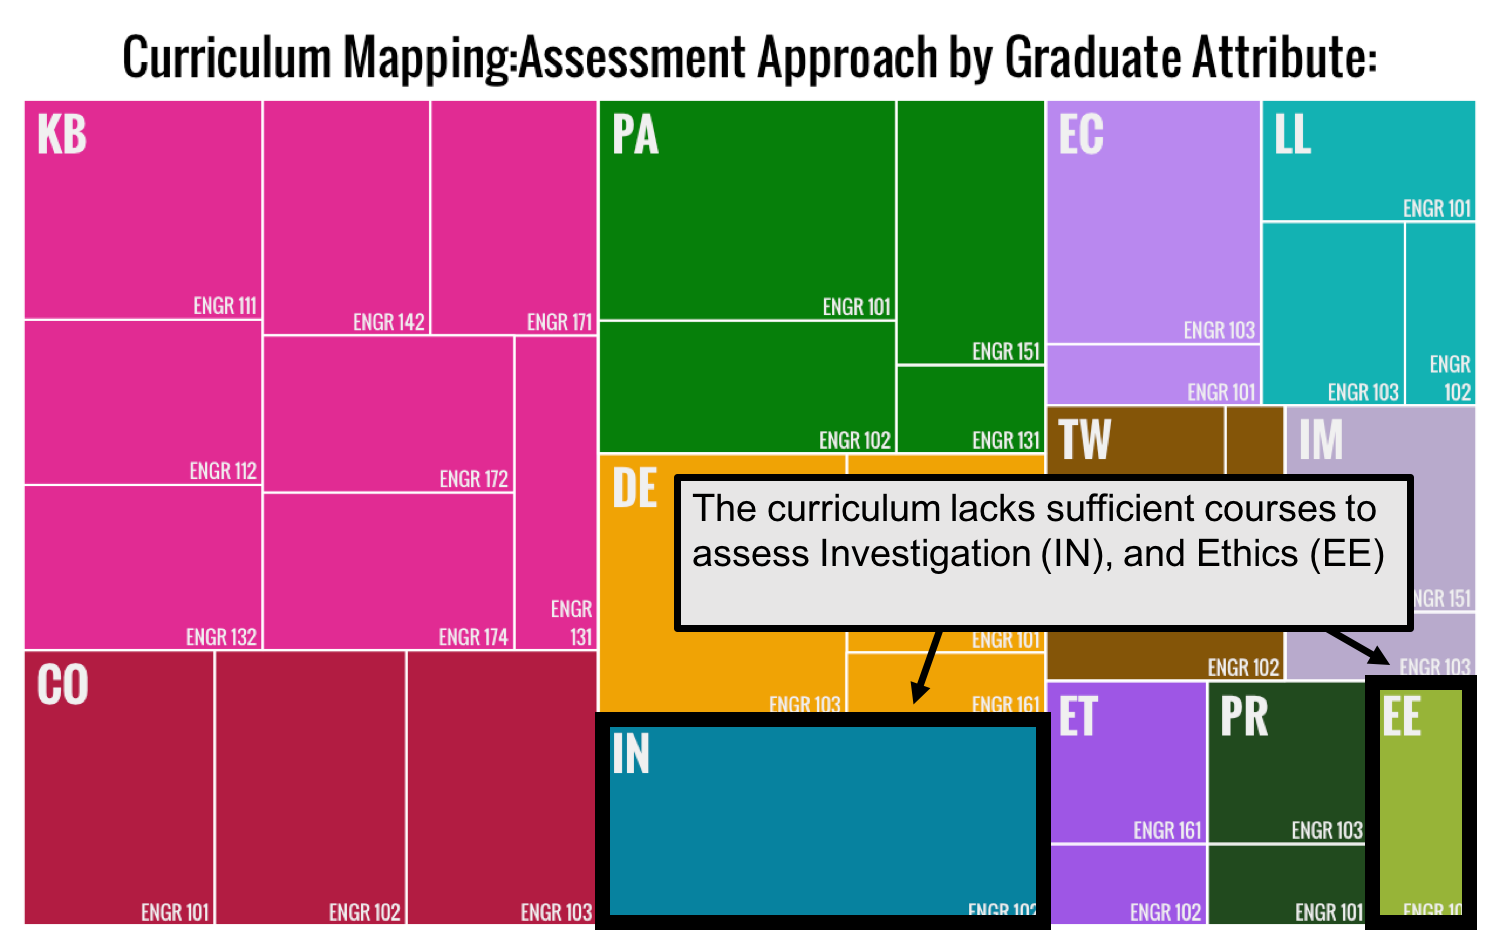
Coincident with the many approaches to mapping, there are many methods that can assist you in visualizing your curriculum in order to assess the balance, alignment, emphasis and progression. For an example, scroll through the four windows below, which show a treemap visualization of assessment mapping results.
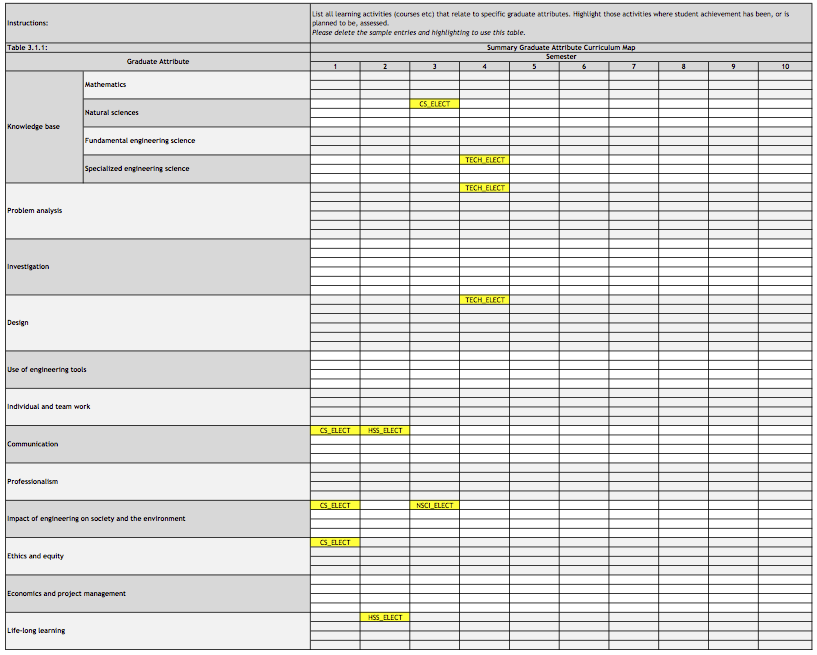
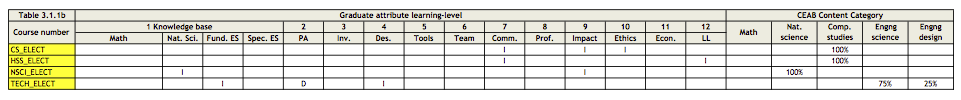
The figure represents a typical first year engineering curriculum with individual courses listed in the bottom right hand corner of each smaller box. The courses are grouped according to graduate attribute and can be used to discern patterns and areas of emphasis in the curriculum.
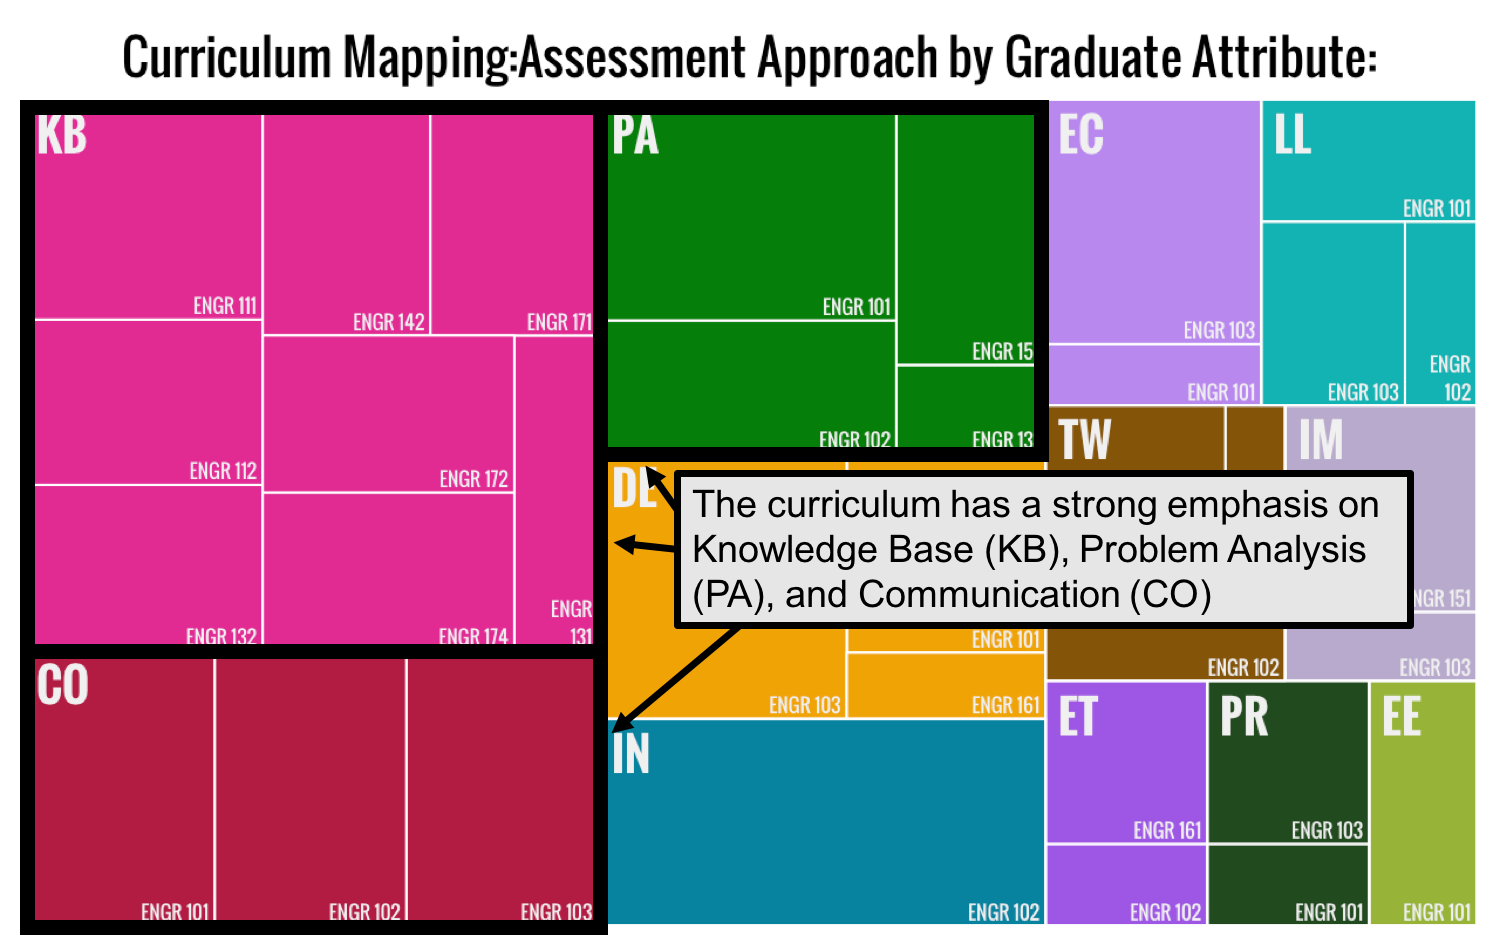
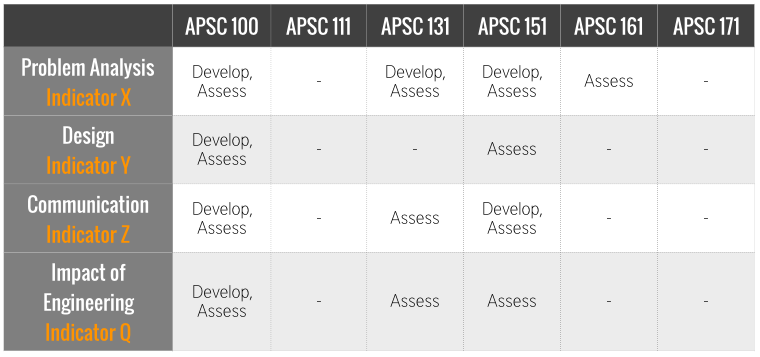
The EGAD Project offers this example from our files, which showcases the Introduce, Develop, Assess style of mapping. Note that the style or encoding of a map varies with approach, but the method of collecting the underlying data is almost always done in a matrix.
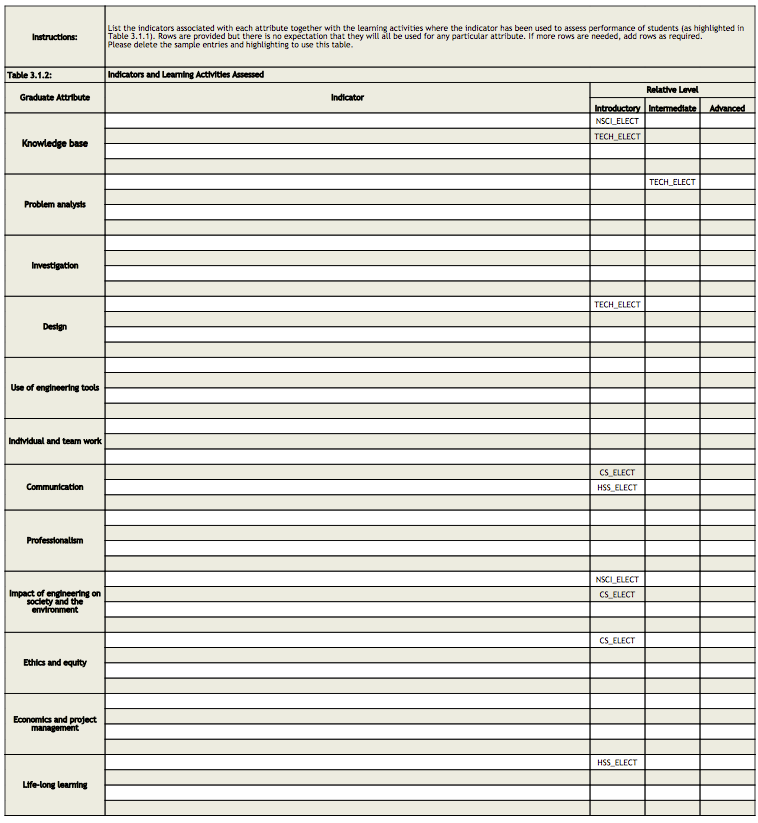
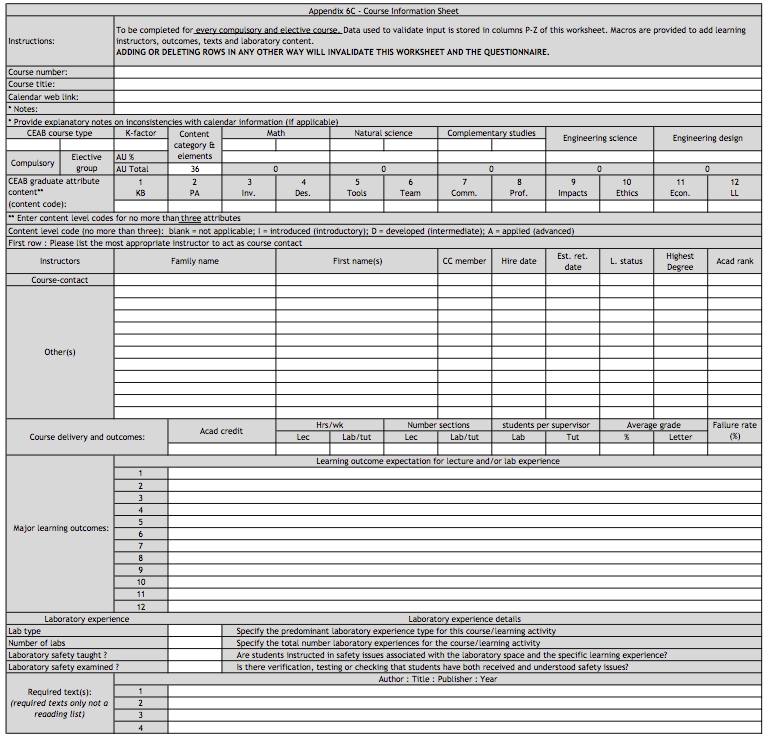
Meeting CEAB Accreditation Reporting Requirements
Accreditation reporting requires the completion of the following CEAB templates: